Be careful what you wish for: Error measures for regression using R

Almost 10 years ago I was working with evolutionary strategies for tuning neural network for time series prediction when I became curious about error measures and the effects on the final forecast. In general, evolutionary algorithms use a fitness function that is based on a error measure. The objective is to get better individual(s) minimizing (or maximizing) the fitness function. Thus, to determine which model is “the best”, the performance of a trained model is evaluated against one or more criteria (e.g. error measure). However, the relation between the lowest error and “best model” is complex and should be applied according with the desirable goal (i.e. forecasting average, forecasting extremes, deviance measures, relative errors, etc.).

There is a journal paper which gives the description of the errors used in the ‘qualV’ package. This package has several implementations of quantitative validation methods. The paper (which is very interesting by the way), also has some examples of how the final results of the errors measures change when dealing with noise, shifts, nonlinear scaling, etc.

The objective of this post is just to show the problem, and raise the awareness when measuring the best model based on error only. Sometimes the minimization of one error measure does not guarantee the minimization of all other error measures and it even could lead to a pareto front. Here i am using some of the functions described in the paper and for simplicity i am comparing here only 4 errors measures: mean absolute error (MAE), root-mean-square error (RMSE), correlation coefficient (r) and mean absolute percentage error (MAPE). Each error measure is measuring a distinct characteristic of the time series and each of them has strong and weak points. I am using R version 3.3.2 (2016-10-31) on Ubuntu 16.04.

Case (i): Adding noise

Lets say we have the function with the original signal given by:
y=a\sin(\pi x b)+s.

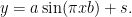
Using x=[0,1], a=1.5, b=2, and s=0.75 then:

x = seq(0,1,by=.005)
ysignal = 1.5*sin(pi*2*x)+0.75
plot(x,ysignal,main = "Main signal")

figunnamed-chunk-1-1

We should change the original signal and check how this will affect the final result. If the “forecast” is the same as the signal then all the errors should be 0. Thus applying some noise to the signal s=(0.75+noise), where noise comes from a Gaussian function with mean=0 and standard deviation =0.2, and comparing with the original signal we get:

library(qualV)
n = 0.2 #noise level
noise = rnorm(length(x),sd=n)
ynoise = ysignal+noise
par(mfrow=c(1,2))
range.yy <- range(c(ysignal,ynoise))
plot(x,ysignal,type='l',main = "Adding noise"); lines(x,ynoise,col=2)
plot(ynoise,ysignal,ylim=range.yy,xlim=range.yy,main = "Signal vs Forecast") 

figunnamed-chunk-2-1

round(MAE(ysignal,ynoise),2)
## [1] 0.16
round(RMSE(ysignal,ynoise),2)
## [1] 0.21
round(cor(ysignal,ynoise),2)
## [1] 0.98
round(MAPE(ysignal,ynoise),2)
## [1] 40.65

Case (ii): Shifting the signal

Lets apply a shift on the values of the original signal. With s=0.95 we have:

yshift = ysignal+0.2

figunnamed-chunk-3-1

round(MAE(ysignal,yshift),2)
## [1] 0.2
round(RMSE(ysignal,yshift),2)
## [1] 0.2
round(cor(ysignal,yshift),2)
## [1] 1
round(MAPE(ysignal,yshift),2)
## [1] 60.95

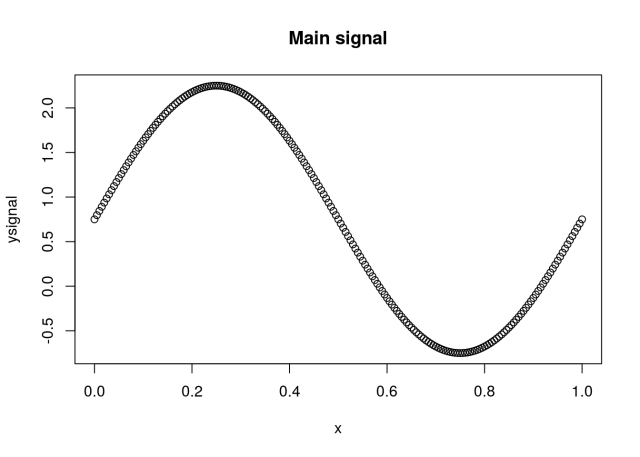
Case (iii): shift + rescale

Lets apply a shift and also rescale the values of the original signal. Doing a=0.8 and s=0.95 we have:

yresshift = 0.8*ysignal+0.2

figunnamed-chunk-4-1

round(MAE(ysignal,yresshift),2)
## [1] 0.19
round(RMSE(ysignal,yresshift),2)
## [1] 0.22
round(cor(ysignal,yresshift),2)
## [1] 1
round(MAPE(ysignal,yresshift),2)
## [1] 61.66

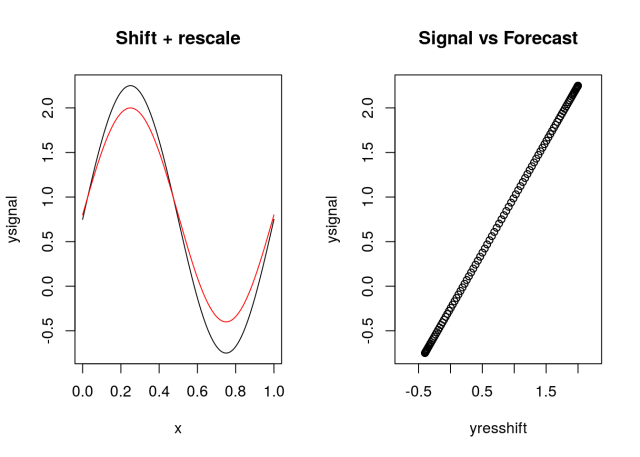
Case (iv): Changing the frequency

In this case lets vary slightly the frequency of the original signal making b=2.11:

yfreq = 1.5*sin(pi*2.11*x)+0.75

figunnamed-chunk-5-1

round(MAE(ysignal,yfreq),2)
## [1] 0.17
round(RMSE(ysignal,yfreq),2)
## [1] 0.22
round(cor(ysignal,yfreq),2)
## [1] 0.98
round(MAPE(ysignal,yfreq),2)
## [1] 89.33

Each case has the original series (in black) and the possible “forecast” (in red). I also plotted the original series (signal) versus the residual series. Which case would you pick as the best forecast? What is your assumption?

The journey of music and knowledge

Since I started my progressive rock project I’ve been receiving great support. Thank you all. It’s been an amazing journey.  In this small post i will try to describe how’s been.

It’s been a pleasure to record the album for two reasons. First finally i have the opportunity to play my favourite musical genre, of course progressive rock. I am using crazy effects, creating different atmospheres with easy and hard parts, expressing myself as an artist, and creating an amazing story. Second, because of the readings I am doing, I’ve been learning so much about the world, climate, climate change and consequences. Oh boy, so many books and papers. So much to learn about how the world is interconnected.

The project is beautiful but it is not easy. There are lot of difficulties. As a musician, the first challenge after the songs are ready is the recording process, and it is not an easy task. Why? Mainly because of money. Recordings demand time and money. To do any recording, even the simplest one (with good quality), some minimal equipments are necessary. Also it is a lot of work. These are the two main reasons why professional musicians (and studio engineers) don’t like to play (work) for free. However, this is another topic lets get back to my process.

I’ve done some sessions before, so I have good equipment to record my bass. Therefore, almost all the recordings can be done in a home studio. In addition, it is cheaper than any professional studio, right? True, but the home studio won’t simply appear in my desk out of nowhere. That was my first hit. Even if I am able to record everything by myself (which mostly i can do anyway but some musicians friends will contribute), I still don’t have the whole equipment necessary to record the whole album. This is slowing the process a bit because I don’t have all the money necessary to buy everything at once. Therefore, I am not only recording the songs by parts but also buying the necessary equipment by parts (used and new).

This is only the first bump. It is certain that I will have more bumps during my journey which is part of the job. So far the songs are (in my rumble opinion) becoming awesome! My plan is to release the first song by December. Lets see if i can keep this deadline.

Weather Forecasting: Is it better to toss a coin?

Why Is Weather Forecasting Always Wrong?  Have you asked yourself the same question? Have you cursed the weather forecasting when you were expecting a sunny day and then rained? Does this picture looks familiar?

tempoeficaz

Once I was in Toronto when the forecasting for the other day was a blizzard. Basically, lots of snow. When that day finally arrived we had half of the expected snow. I friend of mine said: “It is the government. They say more snow will fall than what is expected to scare the people.” Well at that time my knowledge about weather and atmospheric science was minimal. I did not know what to think. Is my friend right? Is the government really doing this? What is the real reason behind? Are the guys responsible for the weather forecasting incompetents? A few years ago i did a seminar giving a brief explanation of how hard is to predict weather. Unfortunately the slides do not come with detailed information. Thus, to answer some questions about weather forecasting I will do a series (not consecutive) of posts explaining why weather is so hard to predict. In addition I will try to give an overview of  how it is predicted. I will add the posts under the category ¨Weather Forecasting”.

To explain the whole weather forecasting problem it is really hard, almost impossible. For example:

Despite the detailed knowledge about precipitation including the complete hydrological cycle (evaporation, water vapour, convection, condensation, clouds, soil moisture, groundwater and the origin of rivers), predicting precipitation accurately is still one of the most difficult tasks in meteorology (Kuligowski:1998)

I know the paper is old but the problem persists. Even in 2014 precipitation still a major forecasting challenge. Some of the reasons are:

  • The chaotic nature of the atmosphere and the complexity of the processes that are involved in precipitation
  • The difficulties of precipitation measurements including problems with rain gauges, radar and satellites
  • The limited temporal and spatial scales of numerical weather prediction (NWP) models?

My goal is to provide information about the most important parts of the weather forecasting. Of course at the end of the posts, if I am missing something please let me know but I hope my posts will be enough to anyone know that the scientists are doing a really good job and they are really hard work guys and if they are missing is not because conspiracy or incompetence. It is because the problem is really hard.


Journal references:

Kuligowski, R., & Barros, A. (1998). Localized Precipitation Forecasts from a Numerical Weather Prediction Model Using Artificial Neural Networks Weather and Forecasting, 13 (4), 1194-1204 DOI: 10.1175/1520-0434(1998)0132.0.CO;2

[Random News] Frozen Underworld Discovered Beneath Greenland Ice Sheet and more…

Due the lack of time I am not writing long topics anymore, but as soon as I can I’ll return to the normal posts. Meanwhile here are some (late) news of the week.

  1. Frozen underworld discovered beneath Greenland ice sheet
  2. NOAA Deploying New Drones Into Hurricanes
  3. Industry Endangering Forests in Alberta Rockies, Study Says

Frozen Underworld Discovered Beneath Greenland Ice Sheet

Scientists have discovered a frozen underworld beneath the ice sheet covering northern Greenland. The previously unknown landscape, a vast expanse of warped shapes including some as tall as a Manhattan skyscraper, was found using ice-penetrating radar loaded aboard Nasa survey flights.
Well, what does it mean? It means that the findings could deepen understanding of how the ice sheets of Greenland and Antarctica respond to climate change. There is a brief explanation of how this underworld could influence the melting of the ice sheet in the part three of the documentary I posted here a few weeks ago The climate wars.

Photo credit: Jason Gulley

Continue reading