Much of the Arctic Ocean is covered by sea ice which varies in extent and thickness seasonally. The Arctic sea ice extent has been shrinking (during the summer) and growing (during the winter) over decades (achieving the maximum in April and the minimum in September). However a sea ice loss has been observed in recent decades. For example the average ice extent for March 2014 was the fifth lowest for the month in the satellite record which supports the idea of sea ice decline.

Monthly March ice extent for 1979 to 2014 shows a decline of 2.6% per decade relative to the 1981 to 2010 average. Credit: National Snow and Ice Data Center
In 2012, Peter Wadhams published a paper talking about how fast sea ice decline is happening:
Arctic sea ice extent had been shrinking at a relatively modest rate of 3-4% per decade (annually averaged) but after 1996 this speeded up to 10% per decade and in summer 2007 there was a massive collapse of ice extent to a new record minimum of only 4.1 million km2. Thickness has been falling at a more rapid rate (43% in the 25 years from the early 1970s to late 1990s) with a specially rapid loss of mass from pressure ridges. The summer 2007 event may have arisen from an interaction between the long-term retreat and more rapid thinning rates.
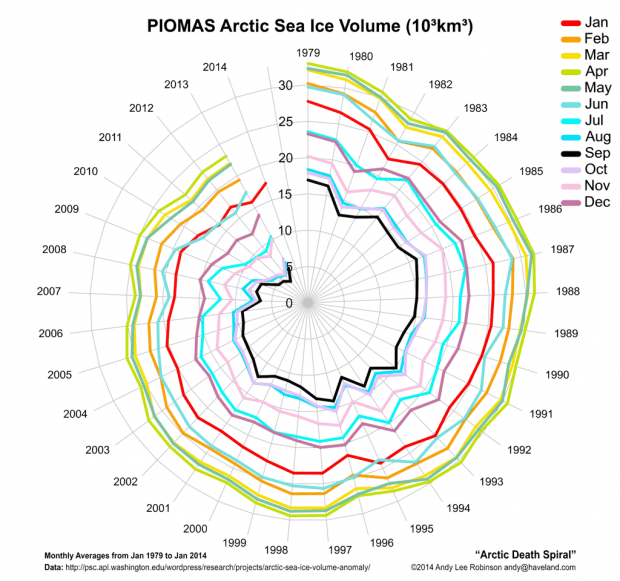
But what is exactly the Arctic ice death spiral? Arctic sea ice volume cannot currently be observed continuously. Observations from satellites, Navy submarines, moorings, and field measurements are all limited in space and time (I can add a post later talking about how the measurements are make). The Sea Ice Volume can be calculated using the Pan-Arctic Ice Ocean Modeling and Assimilation System (PIOMAS). The PIOMAS uses observations (satellites, Navy submarines, moorings, and field measurements) and numerical models (computer programs) to provide estimative of sea ice volume on a continous basis. One way to visualize the data generated by PIOMAS is using a circular plot. Using this particular plot, a circle is when there is no difference between the shrinking and the growing amount. However instead of circles the plot shows spirals moving towards the centre of the graph where zero means no sea ice. This could affect the Greenland ice sheet, North Atlantic deep-water formation regions, boreal forests, permafrost and marine methane hydrates.

Arctic Death Spiral by Andy Lee Robinson
Similarly to my last post, the youtube video bellow represents the sonification of the Arctic Death Spiral for May 2013 made from PIOMAS data. The soundtrack is calculated from the data using 500km3 per semitone using a piano.
And a more complex song with funky graphic:
But How serious is this ? The Inuit (Eskimo) population is witnessing how their security, health and traditional cultural activities jeopardize. The very human reaction to climate change in the Arctic (dominated by the increase of activities such as transportation, shipping, and resource exploitation) may contribute to accelerate the changes already happening. Thus, It is so serious that Canada is already taking action. On 6 December 2013, Canada submitted a claim to extend its continental shelf in the Arctic (which includes the North Pole) to the UN Commission on the Limits of the Continental Shelf.
If you have extra time and want to know a little bit more about the sea ice decline you could watch this documentary. It is a little bit amateur but it delivers the message.
Please, let me know you opinion. Leave a comment!
More information:
http://psc.apl.washington.edu/wordpress/research/projects/arctic-sea-ice-volume-anomaly/
http://www.sciencedaily.com/releases/2012/01/120130171913.htm
http://www.theguardian.com/environment/earth-insight/2013/may/02/white-house-arctic-ice-death-spiral
http://e360.yale.edu/feature/linking_weird_weather_to_rapid_warming_of_the_arctic/2501/
http://www.un.org/depts/los/clcs_new/submissions_files/submission_can_70_2013.htm
Journal References:
Carlos M. Duarte, Timothy M. Lenton, Peter Wadhams, Paul Wassmann. Abrupt climate change in the Arctic. Nature Climate Change, 2012; 2 (2): 60 DOI: 10.1038/nclimate1386
, , , and (2011), Recovery mechanisms of Arctic summer sea ice, Geophys. Res. Lett., 38, L02707, doi:10.1029/2010GL045698.
Peter Wadhams, (2012), Arctic Ice Cover, Ice Thickness and Tipping Points, AMBIO, 41, 23-33, doi:10.1007/s13280-011-0222-9

That’s absolutely brilliant! Can I use it in my lectures?
LikeLike
The videos and pictures are not mine but you can find the real authors in the legend or clicking on them. Feel free to use anything i wrote.
By the way, are you the author of the paper i cited?
LikeLike